M3 verification ledger¶
What was measured for the fleet dashboard and the dispatch API, how, and what is
still unverified. The interfaces it verifies are
fleet-api.md and, unchanged, control-plane.md.
1. The broker question M1 left open — decided and measured¶
M1 found that conda-forge's mosquitto is built without libwebsockets, which the
dashboard's read path depends on (m1-verification.md §4).
Of the three options recorded there, M3 takes the first: a container
mosquitto, which is also what the design already has the fleet server being.
EMQX is not needed at this size, and a WS↔MQTT relay in the fleet API would put
a service back in the middle of the read path that Q5 argues to keep clear.
$ pixi run fleet-broker-ws        # renamed to `pixi run fleet-broker` in Ms
broker: eclipse-mosquitto:2 (docker)   state: ~/.mote-fleet   config: …/mosquitto.conf
1785092291: Opening ipv4 listen socket on port 11883.
1785092291: Opening ipv4 listen socket on port 19001.
(The ports are shifted by 10000 in this run and in §2: the workstation already had the M1 conda broker on 1883, serving a live robot, and taking it down to measure a replacement was not the point. The shipped config uses 1883/9001, and §6 runs on those.)
Two things fell out of running it:
eclipse-mosquitto:2is now mosquitto 2.1.2, which implements WebSockets itself rather than linking libwebsockets —ldd | grep websocketsfinds nothing andWebsockets support available.is printed anyway. So "does this build have websockets" cannot be answered by inspecting the binary alone;broker.shuses the link check to decide whether to strip the listener from a conda build, which is the safe direction (a build that does support it and is not detected still runs, just without WS).log_typereplaces mosquitto's default set rather than adding to it. The M1 config namedwarningandnotice, which silently droppederror— which is exactly how the port clash above was found: a second broker was already holding 1883 (the M1 conda one, serving a live robot), and the new one exited with no message at all, so a failed bind looked like a websockets problem for twenty minutes. The config no longer setslog_type; the default set includes errors and the listener lines, which are the direct answer to both "why did it stop?" and "is the WS listener up?".
The conda broker still runs, prints that it has no websockets, says what to run
instead, and serves robots and fleetctl unchanged. (Ms made the container the
default and folded the two tasks into one: that fallback is now
pixi run -e fleet fleet-broker-local.)
2. The operator view, in a real browser — 15/15 checks, off the ROS graph¶
The dashboard is driven by headless Chrome over the DevTools protocol against a
live stack: the container broker, fleet-server, a site bundle to draw on,
enrolled robots, and an operator token. One command builds all of that, runs
the checks and takes it down again:
$ pixi run fleet-ui-check
broker:  eclipse-mosquitto:2.1-alpine on 52619 (mqtt) / 46001 (ws)
server:  http://127.0.0.1:54489  (state in /tmp/mote-ui-check-qhaatfpk)
robots:  mote-01, mote-02, mote-03  on office_world/ground
         mote-03 is offline — the broker published its will

ok   the browser connected to the broker over WebSockets  — broker connected
ok   the roster came from retained MQTT state  — mote-01,mote-02,mote-03
ok   health states are rendered  — ok,degraded,offline
ok   a basemap was resolved for the selected robot  — office_world/ground
ok   the map canvas has pixels on it  — 467726 painted pixels
ok   the health roll-up lists subsystems  — 4 rows
ok   dispatch went through the fleet API  — dispatched c751a9e20c304c1e
ok   the robot answered on task/status  — succeeded,accepted,dispatched
screenshot: fleet-ui.png

ok   a coarse pointer is what the page thinks it has
ok   one pane at a time, with a tab bar to move between them  — {"tabs":"flex","shown":1}
ok   no pane scrolls sideways on a phone
ok   the canvas backing store follows the pane it is in  — 1170x1674 for 1170x1674
ok   picking a robot in the roster shows it on the map  — map
ok   two fingers zoom the map
screenshot: fleet-ui-phone.png
ok   no uncaught page errors  — 0

15/15 checks passed
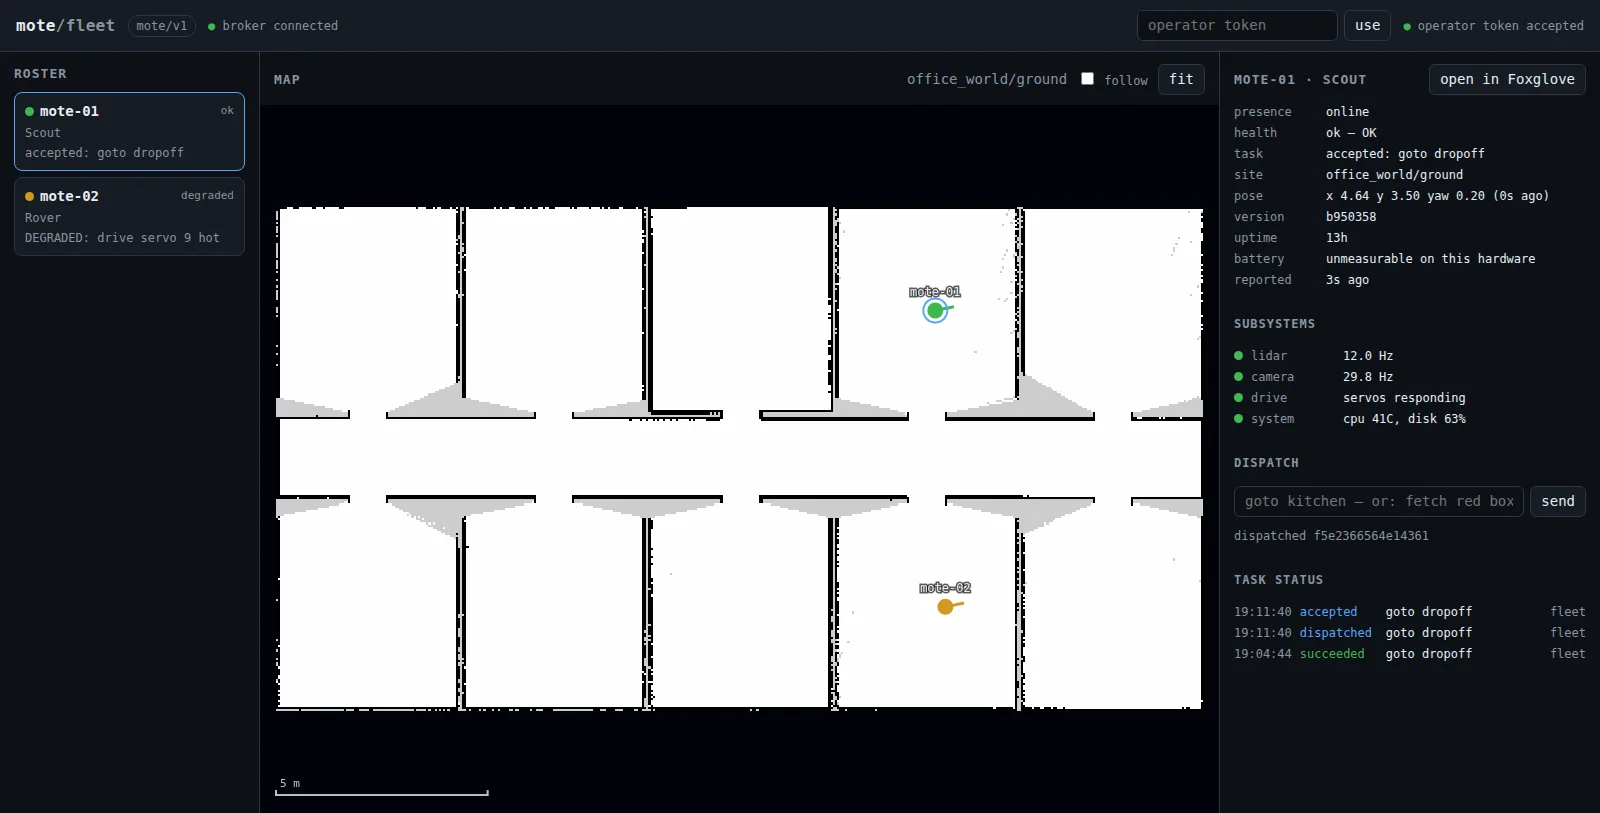
That is the original M3 run's 9 assertions and §9's phone pass, in one command
against a stack it built itself — 6.2 s end to end. The painted-pixel count is
identical to the hand-assembled run's because it is the same basemap: the
harness serves
mote_simulation/sim_home/sites/office_world, the only real saved map
(map.yaml + PNG + zones) committed in the tree, so the world→pixel transform
and the zone overlay are exercised at a real scale rather than against a fixture
that agrees with them.
Nothing is polled by the page: the roster, the health roll-up, all three robot
positions and the task-status log are retained MQTT state that arrives on the
WebSocket within a second of loading. Both colour schemes were rendered
(Emulation.setEmulatedMedia) and checked by eye during the original run; the
committed checks assert what a screenshot cannot, and leave the two themes to
the two screenshots they write.
The robots are the wire, not the hardware. mote_fleet/test/fake_robots.py
publishes protocol.py payloads and answers task/command, and that is the
whole of it — not a second robot implementation but the contract itself, which
is exactly what the UI consumes. What it does model is what the UI renders
differently: an ok robot and a degraded one, a pose that moves, the task
transitions (goto dropoff → dispatched/accepted/succeeded, wibble → rejected
unknown command 'wibble', goto nowhere → rejected unknown zone 'nowhere' —
the same shape as §3's real robot, measured through fleetctl against this
fixture), a redelivered command recognised rather than re-run, and one robot
that drops its socket without a DISCONNECT so the broker publishes its will.
The harness waits on that will rather than on a sleep: an offline row the
fixture published for itself would not be testing the Last Will path at all. The
real agent and behaviour tree are covered by the end-to-end test in §4; what
this run is for is the half only a browser can answer.
Two things it deliberately does not touch. It never uses ~/.mote-fleet — the
registry and the basemaps go in a temp directory that is deleted afterwards —
and it never uses 1883/9001, because the workstation this was measured on was
already running a broker and a fleet server for a real robot on exactly those
ports, and both were still serving when the run finished. Every process starts
in its own session, so teardown reaps this stack and nothing else (verified:
no container, no temp directory and no process left behind). Two runs at once on
different sites — office_world and hospital_world — both pass 15/15, sharing
no port, container or directory.
The broker image is the compose file's pin, read at startup exactly as
broker.sh reads it: a tag of the harness's own would be a third broker able to
drift onto a mosquitto whose websockets support differs, which is the failure
test_deploy_config.py exists to prevent — so that test now watches this file
too.
-- --keep skips the browser and leaves the stack up with its URL and operator
token printed, which is the loop for actually working on server/ui/.
Can it gate CI? — no, and this is the decision rather than an oversight¶
It needs two things the build workflow's runners do not both have:
- docker, because the browser's read path is MQTT-over-WebSockets and
conda-forge's mosquitto is still built without them (re-measured at 2.0.20:
lddfinds no libwebsockets). Hostedubuntu-latesthas docker, so this half would be free there. - a chrome.
ubuntu-latestships one; the matrix's other half,ubuntu-24.04-arm, does not — so wiring it in buys one architecture's coverage of a page that has no architecture-specific behaviour.
The flakiness objection is at least answered: every assertion now polls to a
deadline instead of sleeping a guessed interval (settle() in
browser_check.mjs), so a loaded shared runner makes the job slower rather than
red. What is left is a judgement about a ~40 s job — image pull included — that
would gate every PR on a headless browser to protect the six files in
server/ui/. So it stays a command an operator runs when touching server/ui/,
one workflow step away from being a gate if that changes. Same shape as the sim
smoke test's answer (#51), and for one of the same reasons: hosted CI does not
have the machine the check needs.
3. Dispatch is mediated — confirmed, including the refusals¶
fleetctl dispatch now POSTs to the fleet API instead of publishing. The status
half still reads straight from the broker, so the transitions look exactly as
they did in M1:
$ pixi run fleetctl -- dispatch mote-01 goto pickup --wait 30
an operator token is required: --token, or MOTE_FLEET_TOKEN in the environment.
Mint one on the fleet box with 'fleetctl operator new --name <you>'.

$ export MOTE_FLEET_TOKEN=$(pixi run fleetctl -- operator new --name michael)
$ pixi run fleetctl -- dispatch mote-01 goto pickup --wait 30
-> mote-01: goto pickup  (id 9aec3ce2dab7458f)
2026-07-26T19:03:54.144Z  dispatched
2026-07-26T19:03:54.144Z  accepted
2026-07-26T19:04:00.150Z  succeeded          # exit 0

$ pixi run fleetctl -- dispatch mote-01 wibble --wait 15
-> mote-01: wibble  (id 8365e501be564767)
2026-07-26T19:04:01.644Z  dispatched
2026-07-26T19:04:01.644Z  rejected  (unknown command 'wibble')   # exit 1

$ pixi run fleetctl -- dispatch mote-99 goto home
http://…/v1/robots/mote-99/dispatch: 404 Not Found — no such robot

$ pixi run fleetctl -- audit --limit 6
WHEN                  WHO            ROBOT      RESULT       COMMAND
2026-07-26T19:00:27Z  michael        mote-01    published    goto dropoff
2026-07-26T19:02:42Z  michael        mote-01    published    goto pickup
2026-07-26T19:02:49Z  michael        mote-01    published    wibble
A bug this transcript found and closed: dispatch used to filter incoming
statuses against a correlation id it did not have yet — the robot's dispatched
and accepted can arrive before the HTTP response has been parsed, and they
were being discarded. It now collects every status and filters when it knows
what to filter for.
4. The whole loop, automated — 133 tests, 0 failures¶
$ pixi run -e dev test-fleet
133 passed in 41.19s

$ pixi run -e fleet test-fleet          # no ROS on a fleet box
111 passed, 3 skipped
New coverage, in the tiers mote_fleet/README.md describes:
- contract — the dispatch route's authorize → audit → publish order, its
status codes, the refused-and-recorded case, a revoked token, a broker that is
down (503, audit row
error), the map metadata and both path-traversal attempts, and that the ES modules are served as JavaScript. - browser logic under node (
ui_test.mjs, run bytest_ui.py, skipped where there is no node) — the MQTT packet codec against hand-built wire bytes, including a packet split across two WebSocket frames and two packets in one; and the Q5 world→pixel transform against a real floor'smap.yaml, including that image y runs top-down and that the inverse round-trips. - end to end (
test_e2e_fleet.py) — a new case that dispatches through the real fleet server, with its own paho client, to the real agent and the realmote_taskstree over a real broker: 401 with no token and no command on the wire, then 202, an audit row readingpublished, the correct Nav2 goal, anddispatched → accepted → succeededcarrying the id the API returned.
5. DDS participants — unchanged¶
M0 asks that dds-check be re-run whenever a milestone adds processes. M3 adds
none on the robot: everything here runs on the fleet box or in a browser. The
budget is still M1's ~23 of 33 with foxglove_bridge (M2) unclaimed.
6. Against the real robot — confirmed, over the tailnet¶
Run on mote-01 (a Raspberry Pi on the tailnet, reached direct rather than via
a DERP relay) with the dashboard and the fleet server on the workstation. The
robot was running pixi run robot — bringup plus Nav2 — and mote-agent.service
under systemd, which is the first time that unit has been started by systemd
rather than by hand (an M1 gap, m1-verification.md §5).
The broker swap is undisruptive, and the agent heals itself. The M1 conda
broker was replaced in place by the container one on the same port, over the
same $MOTE_FLEET_HOME, while the robot was connected:
20:21:56  [mote_agent] disconnected from broker; paho will retry
20:22:27  [mote_agent] connected to broker as mote-01
Nothing on the robot was touched or restarted, and nothing about the mission noticed: the agent is a bridge, not part of the control loop.
A live health monitor's payload, at last — the other M1 gap. Every health
state seen before this was unknown or a fixture; this is the real
/diagnostics_agg roll-up forwarded verbatim, and it is what the dashboard's
subsystem list renders:
{"state":"ok","summary":"OK","subsystems":[
  {"name":"scan","state":"ok"},{"name":"scan_filtered","state":"ok"},
  {"name":"joint_states","state":"ok"},{"name":"camera","state":"ok"},
  {"name":"odometry","state":"ok"},{"name":"localization","state":"ok"},
  {"name":"system","state":"ok"},{"name":"self_check","state":"ok","message":"ready"}],
 "site":"home","floor":"ground","version":"b950358","uptime_s":21230.2,"battery":null}
The basemap is a real robot's map, and the transform lands. The home/ground
bundle rsynced off the robot serves as 234x166 px at 0.05 m/px with origin
[-5.98, -4.84]; the reported pose (0.432, 0.210) puts the marker at pixel
(128, 65) — mid-room, where the robot was.
Dispatch, twice, and the failure is the informative one. The first attempt
went out to a robot whose task layer was not running — pixi run tasks is
deliberately not part of pixi run robot, so a nav mission has no task_server
unless one is started. The command reached the ROS graph and nothing answered:
20:34:35  [mote_agent] dispatching 'goto office' (id 407eb9b4393c4064)
20:34:56  [mote_agent] command 407eb9b4393c4064: no verdict from the task server within 20s
which is exactly the state machine's documented behaviour for that case
(control-plane.md) — observed on hardware for the first time, having only been
unit-tested. ros2 topic info -v /task/command confirmed the diagnosis: one
publisher (mote_agent), one subscriber, and it was the bag recorder.
With pixi run tasks started, the same command ran, and the dashboard's status
feed shows both attempts as the operator saw them:
19:42:32  succeeded  goto office                                              fleet
19:41:33  accepted   goto office                                              fleet
19:41:33  dispatched goto office                                              fleet
19:34:56  failed     goto office — no verdict from the task server within 20s  fleet
19:34:35  dispatched goto office                                              fleet
with both attempts in the audit log under the operator who sent them:
2026-07-26T19:34:35Z  michael  mote-01  goto office  407eb9b4393c4064  published
2026-07-26T19:41:33Z  michael  mote-01  goto office  7d679cf267f14058  published
So the whole write path — dashboard → fleet API (authorized, audited) → broker →
tailnet → agent → /task/command → behaviour tree → Nav2 → wheels — and the
whole read path back, are confirmed against hardware. The correlation id
survives every hop in both directions.
Off-LAN, from a phone on cellular¶
The acceptance criterion's "fully off-LAN", which M0 and M1 both had to leave
open. An Android phone with wifi off — mobile data only, behind carrier
NAT — joined the tailnet and browsed to http://mini-pc:8080/. The dashboard
loaded and the operator dispatched from it, against a token minted for the
occasion:
remote is the phone's tailnet address — neither the workstation
(100.76.13.93) nor the robot (100.111.38.42) — which is what makes this row
evidence rather than an anecdote. The robot answered:
{"id":"0ae1ec60998440c2","command":"Test","state":"rejected",
 "detail":"unknown command, have: fetch, goto","source":"fleet","terminal":true}
A rejection proves the round trip exactly as well as a success would: the command was authorized against an operator token, written to the audit log, published, carried over WireGuard to a robot on a different network, forwarded onto its ROS graph, judged by the behaviour tree, and the verdict came back to the browser. Nothing was exposed to the public internet at any point, and no port was forwarded.
Both transports crossed the carrier NAT, not just the API. The header
reported broker connected and the health roll-up rendered — and health,
subsystems and pose exist only on the broker. The roster alone would prove
less, since it also populates from /v1/robots over HTTP; the health panel is
what can only have arrived over MQTT-over-WebSockets. So the read path — the
half that makes the dashboard live rather than polled — works from a phone on
mobile data, which is the claim fleet.md Q5 makes and the reason the broker
needs a WebSocket listener at all.
The one thing the run did not enjoy is the small screen: the layout stacks below 1100 px but was reported as awkward on a phone. Tracked separately — the network property is what this run was for.
7. Two bugs the operator found by using it¶
Both surfaced within an hour of the dashboard going live against the real robot, and neither was reachable from a test that did not involve a person watching.
Retained health kept reading as current after a robot went offline. The
roster marked the robot offline — presence beats health, as designed — and then
the detail pane went on showing ok — OK with eight green subsystem dots,
because retained health is the last thing the robot said. Pose already had a
staleness rule; health had none. A dashboard whose job is situational awareness
must not show green for a robot that is not there.
Now: presence-offline or health older than 30 s (six missed heartbeats) drains
the subsystem dots to grey, dims the block, annotates the health line (last
known), replaces the roster's summary line with offline (last will) — last
seen 2m ago, hollows the map marker, and puts a NOT CURRENT banner at the top
of the pane naming the reason. Verified in a browser against a fleet killed
without a clean disconnect, so the offline state came from the broker's Last
Will rather than from a tidy shutdown — 5/5 assertions, including that the
subsystem dots really are rgb(72, 79, 88) and not the OK green.
fleetctl watch went permanently silent after a broker restart. Reported as
"is it expected that watch stops when a robot ends?" — it is not, and it was not
about the robot. Both watch and dispatch subscribed once, beside the
connect. MQTT subscriptions belong to a session and paho's default session is a
clean one, so paho's automatic reconnect brought the client back subscribed to
nothing: still connected, still running, silent forever. Indistinguishable
from a quiet fleet.
A/B against the same broker, restarting it under both:
| before restart | after restart | |
|---|---|---|
M1's fleetctl watch |
7 lines | 7 — silent, process alive |
| fixed | 48 lines | 366 — resumed |
The subscribe now lives in on_connect (the arrangement agent.py always had),
so every reconnect resubscribes, and subscriber() is a named function so the
property has a unit test rather than only this measurement.
Worth noting what is expected: a dead robot publishes nothing, so watch does
fall quiet when a fleet goes offline — after printing the Last Will. That is the
tail of a live stream doing its job, and it looks the same as the bug, which is
why the bug survived M1.
8. Not verified here¶
- A phone-sized layout. The panes stack below 1100 px, which is not the same as being usable one-handed on a 390 px screen — and the map canvas is the part that suffers. Observed, not designed for. Addressed later — §9 below.
- The Foxglove deep link. The button is rendered from the configured
template and opens
foxglove://…, which needs both the Foxglove desktop app on the operator's machine and afoxglove_bridgeon the robot. Neither exists until M2, so nothing has been observed on the other end of it.--foxglove-url ""hides the button meanwhile. - More than two robots. The roster, the map and the per-floor filter were
exercised with two (scripted), and with one real robot. Marker clustering and
basemap tiling, which
fleet.mdQ5 describes for large sites, are not built — at this fleet size they would be unmeasured complexity. - A robot dropping off while the dashboard watches. The Last Will is tested
against a real broker (
m1-verification.md§2) and the UI rendersofflinefrom the same retained payload, but the two have not been observed together.
9. The phone layout (2026-07-31)¶
Closing §6's "the one thing the run did not enjoy is the small screen" and the first bullet of §8. The network path was already proven from a phone on cellular; what was missing was a layout for the screen it arrived on.
What was changed¶
Below 760 px the three panes become one at a time behind a bottom tab bar;
selecting a robot in the roster navigates to the map; the map canvas gained
pinch-to-zoom and a fingertip-sized hit target; and the dispatch box gained a
zone picker that writes goto <zone> rather than sending it. The operator flow
is README.md §9; the breakpoint lives in server/ui/layout.mjs
and the stylesheet is held to it by ui_test.mjs, because the two failing to
agree produces a tab bar over stacked panes rather than an error.
How it was measured¶
ui_test.mjs grew the pinch arithmetic (pinchSpan, pinchUpdate) and the
seams that fail silently: the CSS/JS breakpoint, every pane having a tab, and
touch-action: none on the canvas. 24/24 under node.
browser_check.mjs grew a phone pass — 390x844 at device scale 3, mobile
metrics and touch emulation on, driven with real Input.dispatchTouchEvent
gestures rather than synthesised DOM events. Against a live stack (container
broker, fleet server, three scripted robots on the office_world bundle — since
this was measured, that stack is pixi run fleet-ui-check and those robots are
the committed fake_robots.py, so this pass is now the tail of §2's run):
ok   a coarse pointer is what the page thinks it has
ok   one pane at a time, with a tab bar to move between them  — {"tabs":"flex","shown":1}
ok   no pane scrolls sideways on a phone
ok   the canvas backing store follows the pane it is in  — 1170x1674 for 1170x1674
ok   picking a robot in the roster shows it on the map  — map
ok   two fingers zoom the map
Separately, in a Playwright context with hasTouch (so pointer: coarse
actually matches, which CDP touch events alone do not cause): a tap landing
20 px off a robot marker selected it — inside the touch target, outside the
14 px one a mouse gets — and after a pinch centred on that marker, a tap at the
same screen point still selected it, which is what shows the zoom anchors where
the fingers are rather than drifting. A goto dropoff chosen from the zone
picker dispatched through the API and wrote the expected audit row.
Three bugs this found, all pre-existing¶
hiddendid not hide..revisionsand.dispatchsetdisplay: flex, which outranks the attribute's UA-stylesheetdisplay: none— so the promote picker rendered empty on every floor with no candidate. Invisible on a desk; a wasted row of a phone. Fixed with a[hidden] { display: none !important }rule, which also covers anything added later.- The canvas backing store was resized on width alone. A height change
without a width change — a tab switch, the toolbar rewrapping, a mobile URL
bar sliding away — left
clearRectunable to reach the bottom of the store, and the previous frame's scale bar stayed on screen under the new one. - The scale bar was drawn in the dark theme's near-white, on a basemap whose
free space is white. A canvas gets no cascade, so the stylesheet's light
theme could not reach it; it now reads
--dimoff the canvas element and is legible in both.
Not verified here¶
- A real device. Everything above is emulation: it gets the viewport, the
device pixel ratio and the touch points right, and the thumb wrong. Reach,
one-handed grip, the on-screen keyboard covering the dispatch box, and iOS
Safari's own chrome are what a phone in a corridor tests and this does not.
The
100dvhheight, theenv(safe-area-inset-bottom)padding under the tab bar and the 16 px input font (which is what stops Safari zooming the page on focus) are all written for that device and confirmed only in Chrome. - Landscape, and tablets between 760 and 1100 px, which still stack.